Application of SVM and Fourier Algorithm in Power System Short-term Load Forecasting
In this paper, Fourier (Fourier) algorithm and SVM (Support Vector Machine) are jointly introduced into short-term load forecasting of power grid. For volatility loads, the Fourier algorithm is used to filter out higher harmonic components. The SVM is used for statistical learning of data filtering high-order components. It firstly filters the historical data related to the predicted points to form training samples, and then combines the smoothness of the prediction and the error loss function to form the objective function of the problem. The corresponding software was compiled and short-term load forecasting was performed on an actual power grid, and the ideal result was obtained.
Keywords: support vector machine, Fourier, loss function, short-term load forecasting, kernel function
ApplicaTIon of SVM
To power system short-term load forecast
Yang Jingfei, Cheng Haozhong
(Department of Electrical Engineering, Shanghai Jiaotong University,
Shanghai, 200030, China)
Abstract: This paper introduces Fourier algorithm and SVM algorithm to short-term load forecasTIng of power system. Fourier method is applied to get rid of the high frequency harmonics. The data without high frequency harmonics are then uTIlized by the staTIstics learning method of SVM( The image function takes both the fatness of prediction and error loss function into consideration. Corresponding software was developed and used to forecast the short-term load of a practical Power system, and the final forecast error is low.
Key words: support vector machines, Fourier algorithm, loss function, short-term load forecasting, kernal function
0 Introduction Power system load forecasting is an important part of grid energy management system. Through accurate load forecasting, it is possible to arrange units to start and stop economically and rationally, reduce rotating spare capacity, rationally arrange maintenance plans, reduce power generation costs, and improve economic efficiency. Common methods include nonlinear regression, neural network, time series, and fuzzy theory. Non-linear regression and time series methods have good predictive effects when the grid conditions are normal, production and meteorological changes are small, but some factors affecting the load, such as rest days, meteorology, etc., cannot be considered. When these factors are abrupt, the prediction accuracy is affected. . The neural network and fuzzy theory take into account some uncertain factors affecting the load, but do not completely solve the problem of network structure design, and require a long training time.
SVM (Support Vector Machine) is a statistical learning method first proposed by Vapnik [1]. In recent years, it has been successfully applied in the fields of speech recognition, text recognition, and timing series prediction. The research shows that the statistical learning method has the advantages of fast learning speed, global optimization and strong promotion ability, and its learning result is often better than other pattern recognition and regression prediction methods. In this paper, the SVM theory is applied to the short-term load forecasting of power systems. It not only considers the factors affecting the load, but also establishes a perfect mathematical model.
The SVM algorithm can achieve better results for systems with smoother prediction load curves. However, for small and medium-sized power grids with small inertia and strong random fluctuations, the effect is relatively poor. The improved method is to use the Fourier algorithm to decompose the historical load curve into two parts: the smooth curve and the random wave curve. Only the smooth part is used as the historical training data of the SVM, which can achieve better results.
1 SVM linear regression model assumes that there is a set of training data, there are a total of l, wherein the i-th data contains the variable and the corresponding variable xi∈Rn and the corresponding variable yi∈R, SVM defines a machine ( Machine), used to determine the mapping relationship x to y x → f (X, a), a is a tunable parameter, which is determined by learning the known data. In linear regression, define the mapping function f(x)= 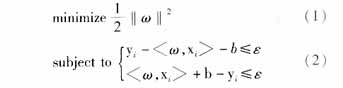
Satisfying (2) sometimes makes the problem very difficult to solve. It can be processed by adding a loss function to the objective function. There are many forms of loss function. In this paper, only the ε-intensive loss function is considered: 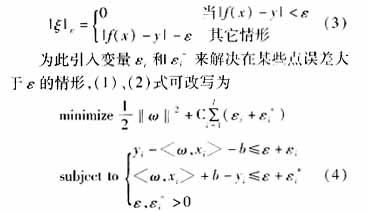
Where C is a constant and is a penalty factor for regression accuracy exceeding the allowable value. (4) For the conditionally constrained optimization problem, according to the nonlinear programming duality theory, the Lagrange equation with no constraints is established, and the minimum problem is transformed into the dual maximum problem: 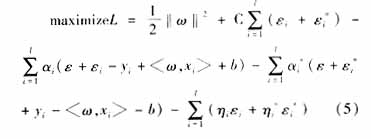
2 Nonlinear regression model and its kernel function Of course, most of the problems in reality are not simple linear problems. To regress nonlinear problems, you can map xi to the feature space τ by mapping φ:X→τ, and then use the kernel. The function k(x,x')=<φ(x), φ(x')> instead of linear regression 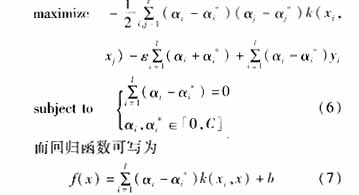
Both linear and nonlinear models can be solved using the interior point method.
3 SVM and Fourier method for short-term load forecasting
3.1 Sample and its input and output volume selection This paper uses the SVM method to solve the short-term load forecasting problem. For the training samples, the data of the same week, the holiday attribute, and the prediction period are first found by clustering as the y value in the SVM, and the corresponding x value (ie, the sample input amount) is divided into the following categories:
1) A = {a1, a2, ..., an}, the load data in the forecast period within n days before the forecast date 2) B = {b1, b2, ..., bm}, the forecast day before the forecast period Load data of the previous m time periods 3) C={c1, c2,..., cs}, weather forecast for the forecast day, a total of s data, including average temperature, maximum temperature, minimum temperature, wind, humidity, etc. 4) D={d1,d2,...,dn}, daily meteorological data within the day before the forecast date, where any element di contains s meteorological data as described above 5) E={e1,e2,... , e7}, the weekly attribute of the forecast day, representing Monday to Sunday, each variable is represented by 1 or 0. 6) F, some of which are derived from known variables and may have an effect on the load. Larger data (such as the difference between the previous day's temperature and the predicted temperature of the day, the difference between the load of the previous two days and the previous day in the forecast period, the average of the load during the forecast period of the week before the day, etc.).
3.2 Support vector machine model for load forecasting In order to select a suitable kernel function, this paper uses linear functions, polynomial functions, radial basis functions, logarithmic S-type and other kernel functions to test, and finds the model of radial basis function. The load prediction problem has the highest accuracy, so this paper chooses the radial basis function as the kernel function.
Assuming that the set of samples constructed according to the above sample and its input and output quantities is {(xi, yi), i = 1, 2, ..., l}, the support vector machine model of load prediction can be written as (6) form, in which ![]() Is a radial basis function.
Is a radial basis function.
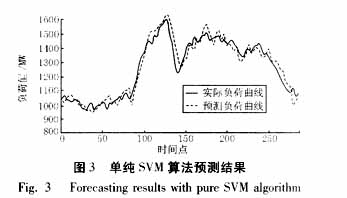
3.3 Fourier algorithm smoothing historical data The digital experiment shows that the SVM method of short-term load forecasting has a good effect on large power grids with large load inertia, but if it is applied to more impact loads (such as rolling mills), the error is large. In order to improve the prediction effect of the algorithm, this paper proposes Fourier transform to transform the daily historical load curve into two parts: smooth curve and random wave curve. Only smooth part is used as historical training data. The method is as follows.
1) For the daily load data to be processed, check whether the difference between the initial point load f(0) and the end point load f(24) is less than a given threshold δ. If yes, it indicates that the curve basically satisfies the basic condition of Fourier decomposition f(0)=f(T); otherwise, the rotation of the time axis is performed such that f(0)=f(T); 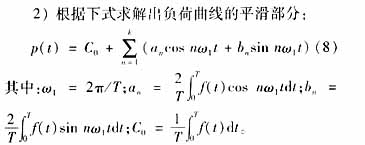
If there is no coordinate transformation, T takes 24 (hours); otherwise, the time axis after coordinate transformation corresponds to the coordinate difference between the initial load point and the end point.
The value of k depends on the fluctuation of the grid load curve. The larger the value should be, the better the fitting effect, but the worse the filtering effect. Through digital experiments, it is found that k takes 15 pairs of undulating regional power grids with better filtering effect and better fitting with the original curve.
3) If the coordinate transformation has been performed, the data is restored to the original time axis.
4 Calculation results and errors The example used in this paper is based on the daily temperature data from March 1 to April 24, 2003 and the load data of 288 points per day provided by Changzhou Power Company. It is predicted to be 96 points on April 25th. The data. In order to investigate the accuracy of the method used in this paper, BP neural network method and SVM algorithm (without Fourier decomposition) were also used for prediction. Figures 1 to 3 show the prediction of the day for the three methods, respectively.
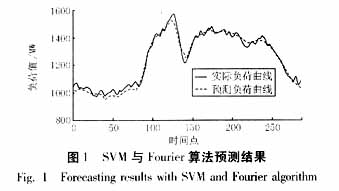
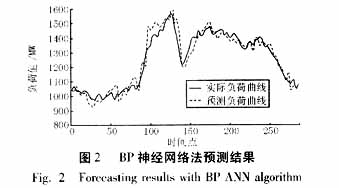
The maximum relative error (absolute value) of the day calculated by the algorithm proposed in this paper is 5.2%, and the average error is 2.4%. Compared with the error results of the neural network method (mean error 4.1%, maximum relative error 11.9%) and simple SVM algorithm (mean error 3.7%, maximum error 10.1%), the method has higher precision. The algorithm proposed in this paper predicts each point. The training program runs from 400 milliseconds to 1500 milliseconds (including filtering time), and the test time is less than 20 milliseconds, which has a faster speed.
5 Conclusions This paper introduces the SVM and Fourier algorithm and its application in power system short-term load forecasting. The algorithm considers the factors affecting the load, clusters the historical data, and finds the data of the same class as the predicted points for training. The Fourier algorithm smoothes the load curve and prevents the interference of random fluctuations on the prediction. As an example, the method is reasonable, fast, and highly accurate. It is an emerging algorithm with great application value.
Our Led Chess is good in quality and competitive in price. We are manufacturer and supplier of Led Chess following your specific requirement. We are looking forward to your E-mail and establishing cooperative relationship with you! We would provide professional Led Chess with good services for you!
We are the professional Led Chess Set manufacturer in China. We can produce Flashing Chess to your requirements. If you want to get more types of Led Chess
Led Chess Set, Flashing Chess, Custom Led Chess
AST Industry Co.,LTD , https://www.astsoundchip.com