The so-called exploratory data analysis (EDA) refers to the exploration of existing data (especially the original data from surveys or observations) with as few a priori assumptions as possible, through drawing, tabulation, equation fitting, A method of data analysis that explores the structure and regularity of data by means such as calculating feature quantities. Especially when we do not have enough experience with the information in these data and do not know what traditional statistical methods should be used for analysis, exploratory data analysis will be very effective. Exploratory data analysis was proposed in the 1960s, and its method was named by the famous American statistician John Tukey.
The emergence of EDA is mainly in the preliminary analysis of data, often unable to carry out conventional statistical analysis. At this time, if the analyst first conducts exploratory analysis on the data, analyzes the patterns and characteristics of the data, and discovers them in an orderly manner, he can flexibly select and adjust the appropriate analysis model and reveal the data relative to the common model Various deviations. On this basis, statistical analysis techniques based on significance testing and confidence interval estimation can be used to scientifically assess the specific patterns of observed patterns or effects.
So in summary, analyzing data can be divided into two stages: exploration and verification. The exploration phase emphasizes flexible exploration of clues and evidence, and finds valuable information hidden in the data, while the verification phase focuses on evaluating these evidences and studying some specific situations relatively accurately. In the verification phase, the main method commonly used is the traditional statistical method. In the exploration phase, the main method is EDA. Below we focus on further description of EDA.
There are three characteristics of EDA: one is to let the data speak in the analysis, not to emphasize the organization of the data. Traditional statistical methods usually assume a model first, for example, the data follow a certain distribution (especially the normal distribution), and then use the method suitable for this model for fitting, analysis, and prediction. But in fact, most of the data (especially the experimental data) can not guarantee to meet the assumed theoretical distribution. Therefore, the statistical results of traditional methods are often unsatisfactory, and their use is greatly limited. EDA can proceed from the original data and explore the internal laws of the data in depth, instead of starting from a certain assumption, applying theoretical conclusions and sticking to the assumptions of the model.
The second is that the EDA analysis method is flexible, rather than sticking to traditional statistical methods. Traditional statistical methods are based on probability theory and use processing tools such as hypothesis testing and confidence intervals with strict theoretical basis. EDA processes data in a flexible and diverse manner. The choice of analysis method is based solely on the data. It is treated flexibly and handled flexibly. Whatever method can be used to achieve the purpose of exploration and discovery. What is particularly emphasized here is that EDA values ​​the robustness and resistance of the method, rather than deliberately pursuing probabilistic precision.
The third is that the EDA analysis tool is simple and intuitive, and it is easier to popularize. Traditional statistical methods are relatively abstract and esoteric, and it is difficult for most people to grasp. EDA emphasizes intuitiveness and data visualization, as well as the diversity and flexibility of methods, so that analysts can see the valuable information hidden in the data at a glance. It shows the universal laws and distinctive characteristics that it follows, promotes the discovery of laws, gets enlightenment, and satisfies the analyst's various requirements. This is also the main contribution of EDA to data analysis.
It is worth mentioning that, because EDA emphasizes more intuitive and graphical display, it uses many innovative visualization technologies. At present, these visualization technologies have a good implementation carrier, and the most mainstream exploratory data analysis software is currently based on The statistical discovery software JMP with good graphic effect, strong interactivity, easy to learn and use. Even analysts who do not have a statistical foundation can easily discover the laws of data, fitting, and residuals with the help of JMP, obtain unexpected discoveries, and inspire ideas and indicate directions for subsequent analysis.
Below, a typical small case is used to illustrate the practical application of EDA.
In order to do some research on the development trend of the global economy and the operating status of the world's top companies, we can download the data from public websites (such as the Forbes 2000 list in http: //), and use JMP to organize it. The data table shown in Figure 1 contains 9 variables such as the name of the listed company, industry, country, year, ranking, market value, asset amount, sales, profit, etc., totaling 14,000 records (2000 articles per year, 7 years from 2004 to 2010). The question now is: with the data, what kind of valuable information is hidden in it? How can we find this information?
Some people say: Since it is continuous data and contains time variables, you should use the time series method for analysis! Indeed, time series can tell us the changes of variables with time, but in reality we hope and can obtain valuable information, Often it's much more than just "time-varying", not to mention, users who need to analyze these business data often don't know what the "time series analysis" method is.
Others said: Use some traditional graphical tools, such as line charts, bar charts, pie charts, etc. to analyze, can you not explore the data? This method seems to be feasible, but there are many categories in these data Variables, they have many levels of classification (for example, the year spans 7 years, the industry is divided into 30, the country has as many as 75, and the company name is as many as 3505). , Where does "data exploration" start?
Table 1: Forbes 2000 ranking data sorted by JMP software
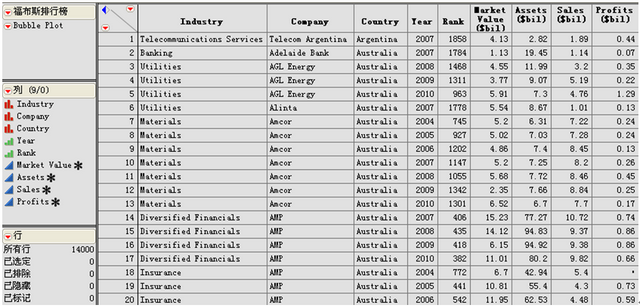
What methods can be used to explore these data well and find the important information we expect or even unexpected? Where should we start analyzing to find this information? Let ’s try to use the visualization technology in modern EDA "Bubble" "Picture" to see and think. With the help of JMP software, we can quickly get a graph similar to Figure 1, where the horizontal axis represents the company's market value, the vertical axis represents the company's sales, the size of the bubble represents the company's profit, and the color of the bubble represents The industry to which the company belongs. The most significant thing is that all the bubbles are not stationary, their position and size will change dynamically with the change of the year. At the same time, the historical trajectory of the entire change will also be displayed in the figure.
What`s your impression for Intel I3 Laptop? You can take i3 Laptop Deals as the entry level of Gaming Laptop . There are different parameters standards,like 14 Inch Laptop I3 11th Generation, 14inch 256GB Intel I5 11th Generation Laptop, 14.1 inch Intel i7 11th Generation Laptop, 15.6 inch I3 10th Generation Laptop,15 inch Intel I5 10th Generation Laptop, 15inch Intel i7 11th Generation Laptop, etc. That`s some of Top 10 Gaming Laptops. To operating OS, more than 80% clients choose windows 10, home or pro option; nowadays windows 11 is new arrival, you can choose as your demand. Rich slots meet your different potential application scenarios, home, office, public places, academic situations, etc.
Dual storage channels, support HDD and SSD. Your customers can update in future according potential demands.
Of course, other type, like yoga notebook, 2 In 1 Laptop , Android Tablet, Custom All In One PC , 14 inch Student Laptop, i7 16gb ram 4gb graphics laptop, etc. available here also. Just call us and get right details quickly.
Intel I3 Laptop,Laptop I3 11th Generation,i3 10th Generation Laptop,i3 Laptop Deals,Laptop Intel Core I3 Gen 11
Henan Shuyi Electronics Co., Ltd. , https://www.hnsylabtop.com