challenge:
Create a process to monitor pulp production in large paper mills to save energy and reduce costs. Solution: To increase throughput, save energy, and optimize production processes, we use NI LabVIEW Data Recording and Monitoring (DSC) modules to handle complex, nonlinear modeling processes.
"The LabVIEW toolkit makes it easier to run multiple models at the same time, which means that online performance monitoring can be straightforward."
Iggesund Paperboard, based in Workington, UK, has five paper machines on its production line, and each paper machine requires at least 15 MW of energy to operate. Saving energy is critical to reducing our operating costs. Therefore, we need a solution to optimize the efficiency of our energy use, while ensuring that the paper machine can produce the pulp required for the final finished board.
Model design
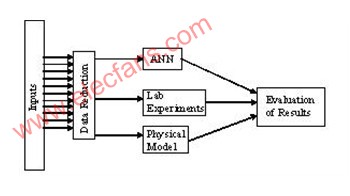
In order to predict the stiffness of the paper, we implemented an artificial neural network (ANN) model based on the feedforward single layer perception (FFSLP) structure. The reason why we choose this model and build it on the multiple linear regression (MLR) model is because the requirements of the modeling process are nonlinear. Artificial neural networks can accurately predict large amounts of paper materials. In addition, for all paper materials, it is convenient to use only one model, making it easier for paper mill operators to use the system.
For the online monitoring function, we combine the artificial neural network with the multivariate data analysis (MVDA) method because this method is more suitable for changes in the operating environment, such as changes in paper materials. The nonlinear model thus established can more accurately predict the machine direction (MD) deviation of the transverse (CD) bending stiffness.
We used LabVIEW software and combined with the artificial neural network technology of advanced adaptive control algorithm used in the closed-loop adaptive paper machine control system to design the prediction model. The solution includes an offline tool that can simulate paper machine loads of different pulp types. This undoubtedly brings the opportunity for operators and development engineers to try different refining configurations and compare and predict the final board quality measurement. By using LabVIEW software to simulate the effect of changing parameters, we have avoided expensive and comprehensive experiments, thereby saving us time and cost.
In addition, the LabVIEW DSC module can conveniently run multiple models in parallel, and provides direct online performance monitoring. Using the LabVIEW DSC module, we limited the model to the range of normal operation of the paper mill. When the variable moves outside the normal operating state range, the alarm will be activated to give the operator a prompt message that the system has a problem, and the system indicates to the operator which variable has failed and the best way to solve the problem.
Online Monitoring
Iggesund Paperboard has successfully used this new model in its online operations. Using the method of score chart, when the variable deviates from the pulp set point, the system will send a prompt message to the machine operator. The score graph represents the scores of the main component analysis of each variable and is updated at one-minute intervals.
Figure 1 shows a two-dimensional monitoring score chart drawn by the scores of two eigenvectors as the horizontal and vertical coordinates. The two-dimensional score map is used to show the relationship between two eigenvectors, which can be represented by a 95% to 99% Hotelling ellipse, which defines the normal operating area during the production process. This allows the operator to easily identify outliers.
All similar data points are gathered on this two-dimensional score map, and each group of data points represents the working point in the production process. These graphs can be used to display a set of data points representing a single working point, or multiple sets of data points representing multiple working points. If the data point remains within the ellipse of Hotelling, this indicates that the operating point is within the normal operating area. Regardless of whether the basic correlation between variables is valid, any abnormal changes in process variables can be clearly displayed using this two-dimensional score map. With the aid of the load diagram, we can determine the source of the problem and eliminate the fault.
in conclusion
We use the model established by the LabVIEW DSC module to provide real-time processing information to the board machine operator. When the variables deviate from the required pulp quality set point, the system will clearly send a prompt message to the operator. The pulp mill operator can select the desired set point and refining energy value to achieve the best results.
Bolt Down Fuse,Midi Fuse,Meqo Fuse,Anl Fuse
Dongguan Andu Electronic Co., Ltd. , https://www.idofuseholder.com