Ankerui Cui Tingyu
Jiangsu Ankerui Electric Manufacturing Co., Ltd.
Abstract: Introduce the projects of Shanghai Sport University International Table Tennis Federation Museum and China Table Tennis Museum. It uses comprehensive protection devices, multi-function meters, transformer temperature controllers, and DC screens to collect various electrical parameters and status signals at the power distribution site. The system adopts the method of on-site networking. After networking, it communicates through the field bus and transmits it to the background. The Ankerui power monitoring system realizes real-time monitoring and management of the power consumption of the power distribution circuit of the substation.
Keywords: Shanghai Sport University International Table Tennis Federation Museum and China Table Tennis Museum Project; 10KV Substation and Distribution Station; Comprehensive Protection Device; Acrel-2000; Power Monitoring System.
0 Overview
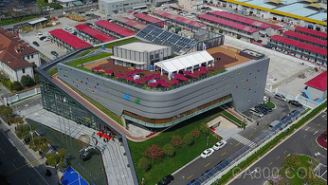
The ITTF Museum was established in Lausanne, Switzerland in 2003. In May 2013, ITTF officially announced that the ITTF Museum in Lausanne, Switzerland will be moved to Shanghai, China, and the ITTF Museum and the originally planned Chinese Table Tennis Museum will be built. Carry out "two museums into one construction". The newly completed "Ping-Pong Expo Hall" is located on the World Expo site in Huangpu District, Shanghai, covering an area of ​​5,000 square meters with a total construction area of ​​10,389 square meters. Among them, the above-ground construction area is 7915 square meters, and the underground construction area is 2,474 square meters. The museum is equipped with exhibition area, public service area, experience interaction area, collection technology area, education research area and other areas. There are more than 12,000 collections in total, and it is equipped with advanced VR interactive experience area, multimedia interactive area and 3D cinema. Shanghai Baoye used 330 days to cast the world's only high-quality project named "International Table Tennis Federation Museum" in the Shanghai World Expo Park, and has successively won honors such as Shanghai Civilized Construction Site, Green Construction Site, and Golden Steel Award.
The project has a total of two 10kV incoming lines, and two 800KVA transformers supply power to the project. 10kV and 0.4kV substation comprehensive protection, multi-function instruments, temperature controllers, DC screens and other equipment are connected to the power monitoring system by RS485 bus networking, and the system host is installed in the substation duty room.
1 Technical standards
The countries and industries quoted in this technical specification are marked as follows:
ISO/IEC11801 "International Integrated Wiring Standard"
GB/50198 "Technical Specification for Monitoring System Engineering"
GB50052 "Code for Design of Power Supply and Distribution System"
GB50054 "Code for Low-Voltage Power Distribution Design"
IEC 61587 "Electronic Equipment Mechanical Structure Series"
GB14285 "Technical Regulations for Relay Protection and Safety Automatic Devices"
GB/3047.1 "The basic size series of panels, racks and cabinets"
GB/T17626.2 "Electromagnetic Compatibility Test and Measurement Technology Electrostatic Discharge Immunity Test"
DL/T720 "General technical requirements for power system relay protection cabinets and screens"
DL/T 698.1-2009 "Part 1: General Provisions"
DL/T 698.2-2010 "Part 2: Technical Specifications of the Master Station"
DL/T 698.31-2010 "Part 3.1: Technical Specifications for Electric Energy Information Collection Terminals-General Requirements"
DL/T 698.35-2010 "Part 3-5: Technical Specifications for Electric Energy Information Collection Terminals-Special Requirements for Low-Voltage Centralized Meter Reading Terminals"
DL/T 698.41-2010 "Part 4-1: Communication Protocol-Communication between the Master Station and the Electric Energy Information Collection Terminal"
DL/T 698.42-2010 "Part 4-2: Communication Protocol-Concentrator Downlink Communication Protocol"
DL/T 698.41-2010 "Part 4-1: Communication Protocol-Communication between the Master Station and the Electric Energy Information Collection Terminal"
DL/T 698.42-2010 "Part 4-2: Communication Protocol-Concentrator Downlink Communication Protocol"
2 System solution
The monitoring system mainly realizes the monitoring and management of the power supply safety of the Shanghai Sport University International Table Tennis Federation Museum and the China Table Tennis Museum Project. The monitoring range is 10KV substation and distribution station: 2 sets of comprehensive protection devices; 140 sets of multi-function meters; 2 sets of transformer temperature controllers; 1 set of DC screens. Comprehensive protection devices, transformer temperature controllers, multi-function meters, and DC screens are connected to the host in this substation through the 485 bus, so as to realize the data connection between the instrument on the bus and the monitoring host on the monitoring host. As shown in the figure below: station control management layer, network communication layer and field device layer.
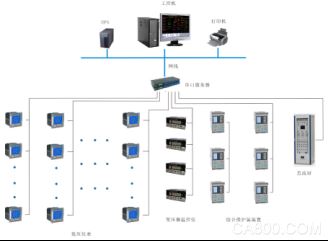
System network topology diagram
1) Station control management
The station control management layer is the direct window of human-computer interaction for the management personnel of the power monitoring system. Mainly refers to the industrial computer, monitor, UPS, etc. placed in the duty room.
2) Network communication layer
The communication layer is mainly composed of collectors and bus networks. The main function of the collector is to monitor on-site intelligent instruments, comprehensive protection devices, transformer temperature controllers, and DC screens; the main function of the bus network is to realize data interaction, so that the management of the distribution system is centralized, informatized, and intelligent, which greatly improves The safety, reliability and stability of the power distribution system have truly achieved the goal of unattended operation.
3) Field equipment layer
The field equipment layer is a data acquisition terminal, which is mainly composed of a transformer temperature controller, a comprehensive protection device, a multi-function instrument, and a DC screen. It is connected to the communication server through a shielded twisted pair RS485 interface and a MODBUS communication protocol bus connection. Reach the monitoring host of the power distribution room for networking and realize remote monitoring.
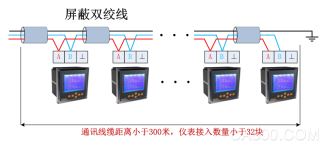
Smart instrument connection diagram
Field instruments are connected hand in hand through shielded twisted pair (RVVSP2*1.0). Each bus is connected to about 25 smart instruments, and then upload the data to the serial server, and then upload the data to the local monitoring terminal. The specific connection diagram is as follows:
3 System function
Features
The system adopts a full Chinese interface, which is simple and convenient to operate; stable and reliable operation; the system has a system diagram display, a simulation diagram display and a network structure diagram display; the system provides a friendly human-computer interaction interface, and all operations can be performed on the interface. And has a remote display function.
login interface
In order to ensure the safe and stable operation of the system, the Acrel-2000 electric power monitoring system is equipped with a user authority management function. Through user authority management, unauthorized operations (such as the modification of the name of the distribution circuit, etc.) can be prevented. The login name, password and operation authority of users of different levels can be defined to provide reliable security guarantee for system operation, maintenance and management.
Main function: The user's level is divided into four levels: operator, shift leader, engineer, and system administrator. Each level can be assigned different operation permissions, including entering operation, exiting operation, remote operation, report management, system configuration, User management, etc. The system administrator is the highest level user, and the higher level users can add or delete the next level users.

Power distribution monitoring interface
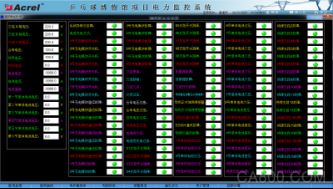
Acrel-2000 power monitoring system has a friendly human-machine interface, which can visually display the operating status of distribution lines in the form of a distribution diagram, and monitor the voltage, current, power, power factor, energy and other electrical parameters of each circuit in real time. Dynamically monitor the closing and opening status of circuit breakers, disconnectors, ground cutters, etc., as well as related faults, alarms and other signals.
Main function: A diagram shows the name of each circuit, current, voltage, total active power, total power factor, closing and opening states of circuit breaker, ground knife, isolating switch, spring energy storage state, and handcart position state.
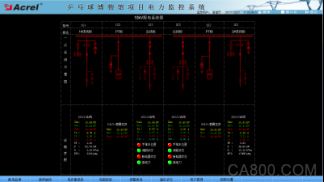
High voltage primary system diagram
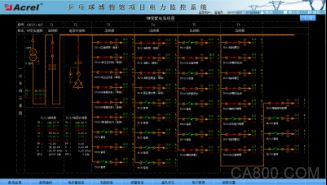
Low-voltage primary system diagram (1)
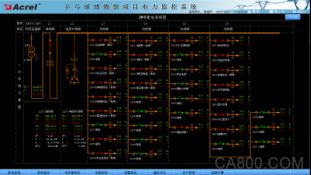
Low-voltage primary system diagram (2)
Communication status
Acrel-2000 power monitoring system supports real-time monitoring of the communication status of each device connected to the system, and can completely display the network structure of the entire system; it can diagnose the communication status of the device online, and automatically display the faulty device on the interface when a network abnormality occurs Or component and its fault location. It is convenient for operation and maintenance personnel to grasp the communication status of each equipment on site in real time, maintain abnormal equipment in time, and ensure the stable operation of the system.
Main functions: It has a complete system communication topology structure diagram, real-time display of equipment communication status, red status indicates normal communication of the corresponding equipment, and green status indicates abnormal communication of the equipment. Beside the system host and serial server/communication management machine, the assigned IP address of the device is marked, and the device address and device loop number are marked by each device.
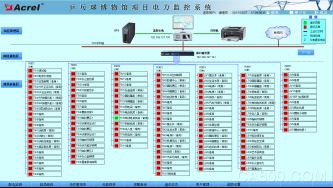
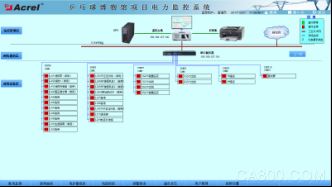
Communication status diagram
Electric parameter report
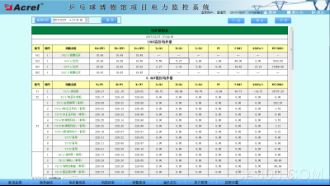
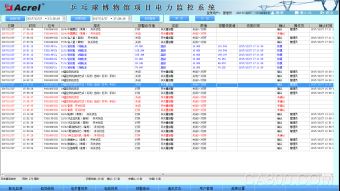
Acrel-2000 power monitoring system has storage and management functions of real-time power parameters and historical power parameters. All real-time collected data and sequential event records can be saved to the database, and the parameters that need to be queried can be customized in the query interface , Specify the time or choose to query the most recently updated record data, etc., and display it in the form of a report.
Main function: Query the operating parameters of each circuit or equipment at a specified time. The electrical parameter information displayed in the report should include: each phase current, three-phase voltage, total power factor, total active power, total reactive power, forward active energy, etc. The electrical parameter report also supports the export of Excel format files, and can also export PDF format files according to user requirements.
Energy report
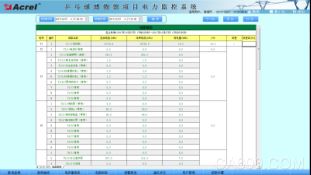
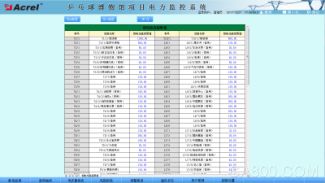
Acrel-2000 electric power monitoring system supports the integrity of the system with a rich report body. The system has the function of regular meter reading and summary statistics. Users can freely query the power consumption of each distribution node in any period of time since the normal operation of the system, that is, the statistical analysis report of the power consumption of the node and the power consumption of each branch circuit. This function makes the electricity consumption visible and transparent, and can be analyzed and traced when the electricity consumption error is too large, so as to maintain the correctness of the measurement system.
Main function: Time selection box with start time and end time. After selecting the time period you want to query, you can query the power consumption of all power distribution circuits within the system project range by clicking the query button. The report can be exported and saved in Excel format via the export button, and the report can be printed via the print button.
Energy report function
Current limit setting
The current limit setting is designed for each loop of the power distribution system. It is convenient for the power distribution maintenance personnel to change the power current setting limit according to the on-site power demand in time. When the current exceeds the limit, the loop power is controlled in time to ensure the reliability of power supply and provide protection for the energy use rights of the user unit.
Power curve
In the power distribution curve graph, the mouse selects the corresponding circuit, you can query the power data within 24 hours and the past 7 days.
The power curve can help users perform power quality analysis and fault analysis.
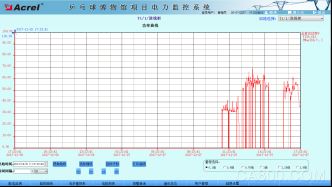
Power curve interface
DC screen
Intuitively display the real-time operating status, fault and alarm switch status of the DC screen.
DC screen interface
Alarms and events
Real-time alarm
The real-time alarm window monitors the remote measurement collected by the system. The alarm window will automatically open when the system is running, and it will always be hidden in the background.
When the current or voltage exceeds the limit and the alarm limit is touched, the "Corresponding Real-time Alarm" window will automatically pop up and display specific alarm information in red font: circuit name, over-limit electrical parameter, alarm value, etc.
History alarm
By adjusting the start time and end time, you can query the system alarm information in any period of time in the past, including remote measurement alarm and remote signaling alarm, as well as specific alarm time, alarm type, alarm content, etc.
4 Effect display
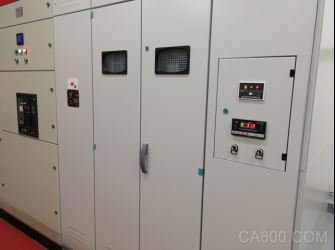
On-site display of effects

High pressure primary system
Transformer temperature controller
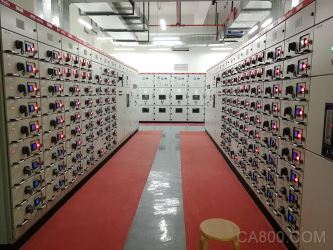
Substation display
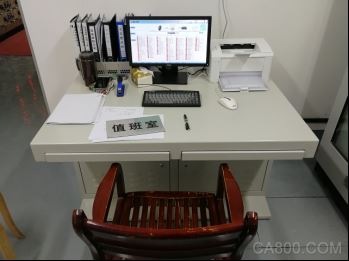
Backstage duty room display
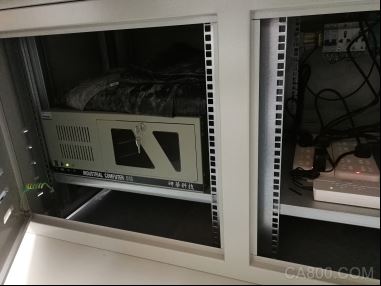
Assembly in front of the console cabinet
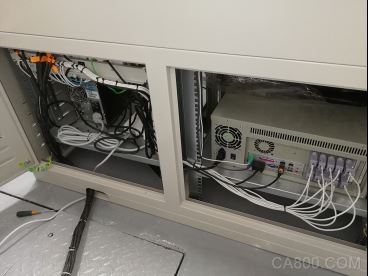
Assemble after the console cabinet
5 concluding remarks
In the application of today’s power distribution facilities, the power distribution safety of the substation is very important. The Acrel-2000 power monitoring system introduced in this article is used in the Shanghai Sport Institute International Table Tennis Federation Museum and the China Table Tennis Museum. The application can realize real-time monitoring of the power consumption of the power supply and distribution circuit of the substation. It can not only display the power consumption status of the circuit, but also has the function of network communication. It can form a power monitoring system with serial server, computer, etc. The system realizes the analysis and processing of the collected data, real-time display of the operation status of the distribution circuits in the substation, and has pop-up alarm dialog boxes, voice prompts, SMS warning lights for opening and closing, load limit violations, and generating various electric energy reports , Analysis of curves, graphs, etc., convenient for remote meter reading, analysis and research of electric energy. The system is safe, reliable and stable in operation, and provides a true and reliable basis for solving electricity problems.
references:
[1]. Ren Zhicheng Zhouzhong. Principle and Application Guide of Digital Instruments for Electric Power Measurement[M]. Beijing. China Electric Power Press. 2007. 4
[2]. Edited by Zhou Zhongzhong. Smart grid user-side power monitoring and power management system product selection and solutions [M]. Beijing. Mechanical Industry Press. 2011.10
About the author: Cui Tingyu, male, undergraduate, Jiangsu Ankerui Electric Manufacturing Co., Ltd., whose main research direction is intelligent building power supply and distribution monitoring system. Email: el.cn QQ: 2881068608 Mobile: 18860995251 Tel: 0510-86179851 Fax: 0510-86179975 Website: http://
Shenzhen ChengRong Technology Co.,Ltd. , https://www.laptopstandsuppliers.com